Debugging code in PyCharm
Debugging code in PyCharm#
This process fixing errors in code is known as debugging. A software bug in an error in your code that makes your program stop or not run as it should be. Debugging your code can also be useful when you want to understand properly what your code is doing. PyCharm offers a really useful tool - the PyCharm debugger. The PyCharm debugger allows you to execute your code one line at a time, and also help you understand how the values of your variables are changing in memory.
To debug your code you must first create a breakpoint, by clicking in the gutter in PyCharm:
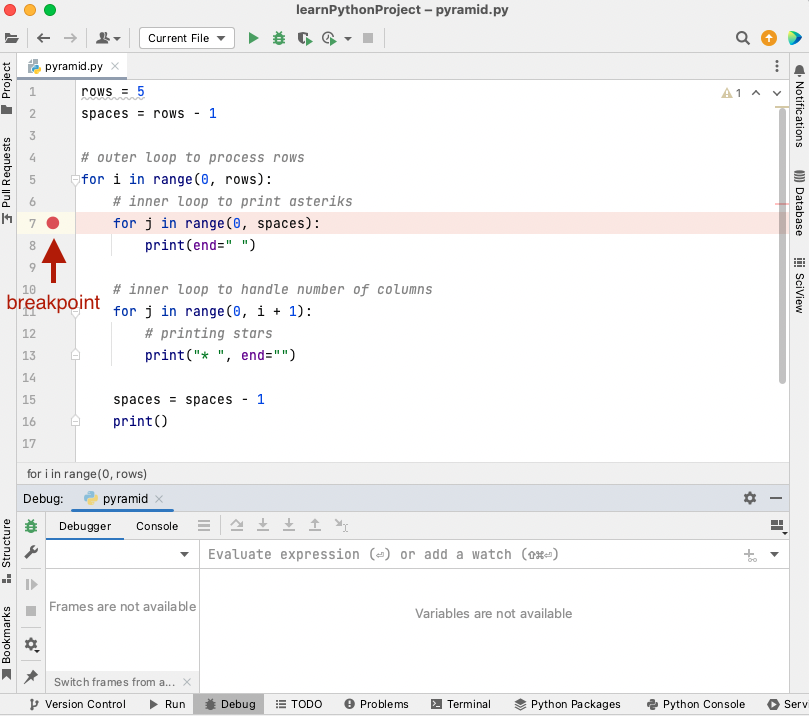
Fig. 16 A breakpoint on line 7 in PyCharm.#
As shown in Fig. 16, the red dot, is the breakpoint. Next, click on the Debug  button. The code will start executing util it reaches the first breakpoint which essentially
pauses the code from executing, allowing you to see the values of the variables at that point. In
the example below, we can see that when the code pauses execution on line 7,
button. The code will start executing util it reaches the first breakpoint which essentially
pauses the code from executing, allowing you to see the values of the variables at that point. In
the example below, we can see that when the code pauses execution on line 7, i has the value of 0, rows 5 and spaces 4 in the
Debug tool window. These values are also shown inline next to the code (inline debugger).
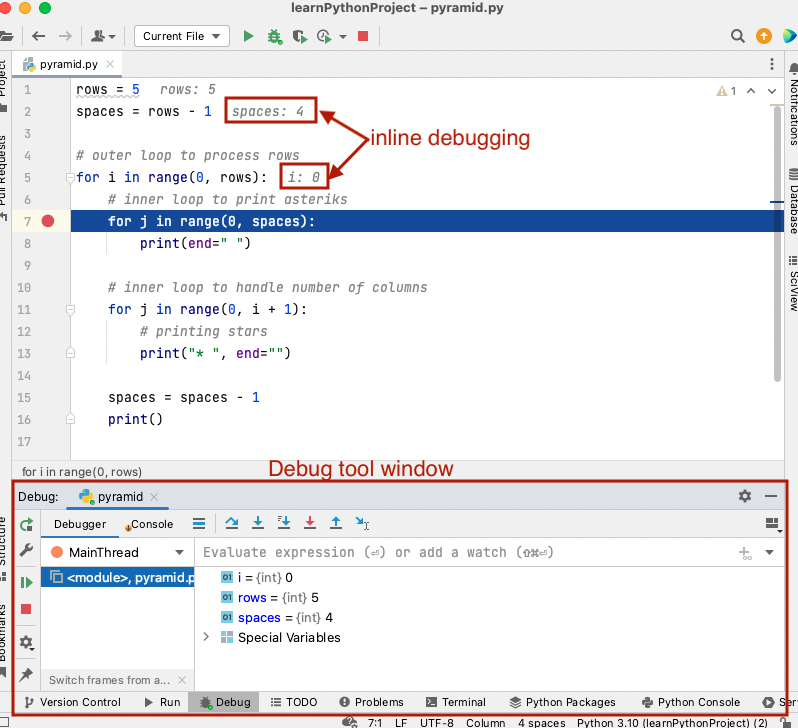
Fig. 17 Debug tool window in PyCharm#
To run one line of code at a time, press the Step Over  button. This is
very useful as it allows you to check what is happening in your code, especially if you are trying to fix an
error in your code. You can put as many breakpoints as you want in your code. Pressing the Resume Program
button. This is
very useful as it allows you to check what is happening in your code, especially if you are trying to fix an
error in your code. You can put as many breakpoints as you want in your code. Pressing the Resume Program  button
will resume execution of program until the next breakpoint is reached. Pressing the Stop
button
will resume execution of program until the next breakpoint is reached. Pressing the Stop  button will stop execution of your program.